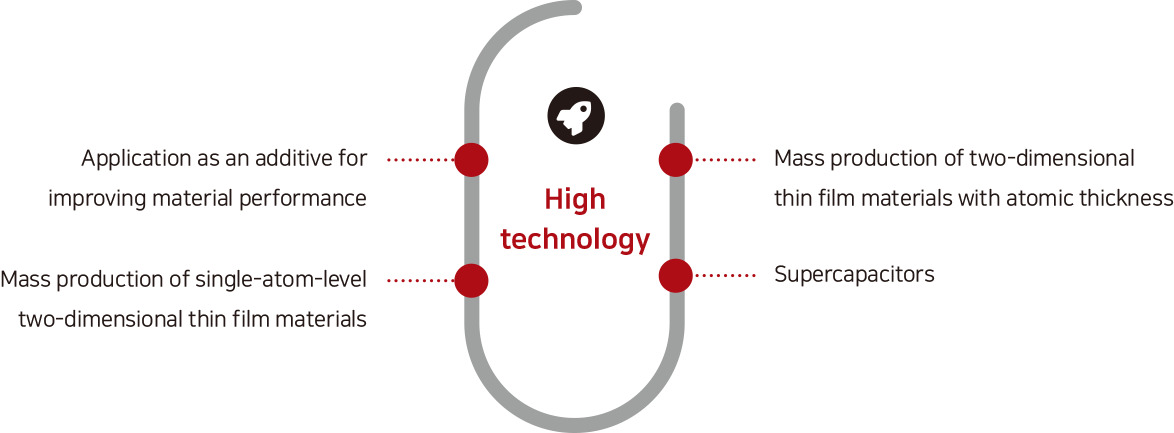
TECHNOLOGY
TECHNOLOGY
Comparison of graphene production methods
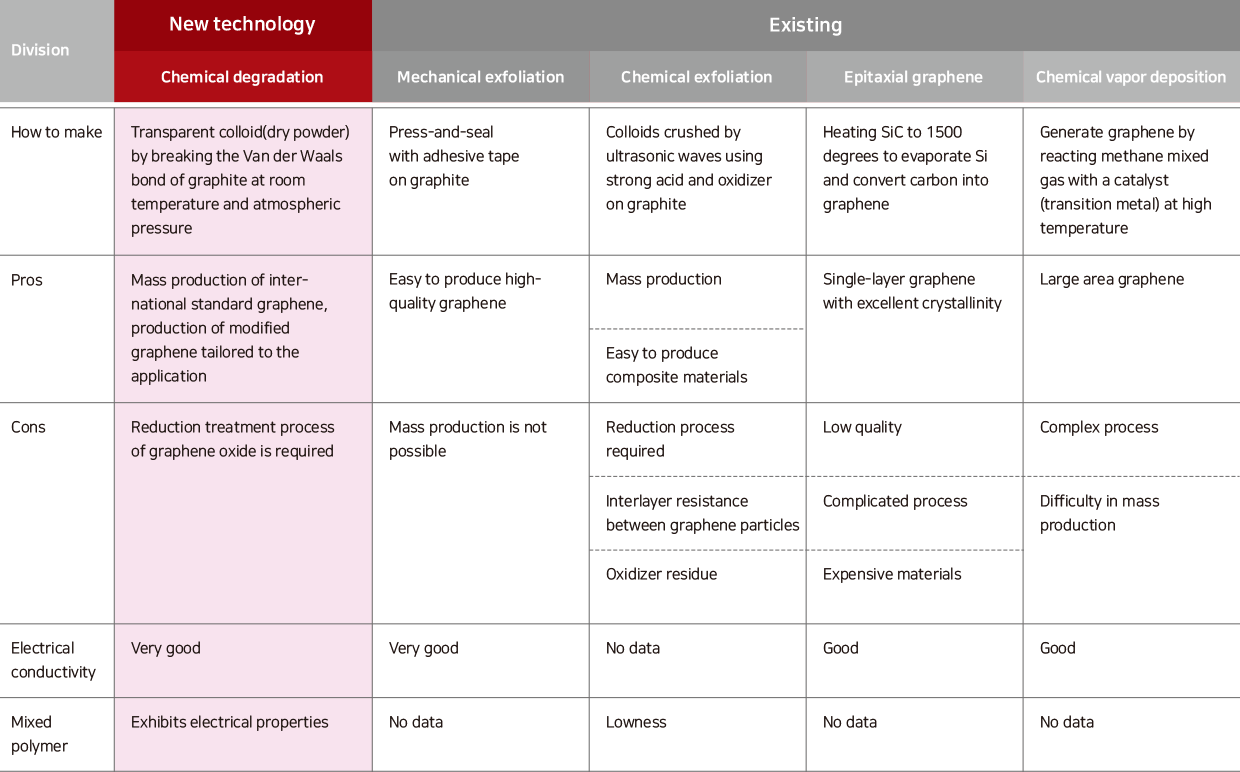
Comparison of graphene production methods
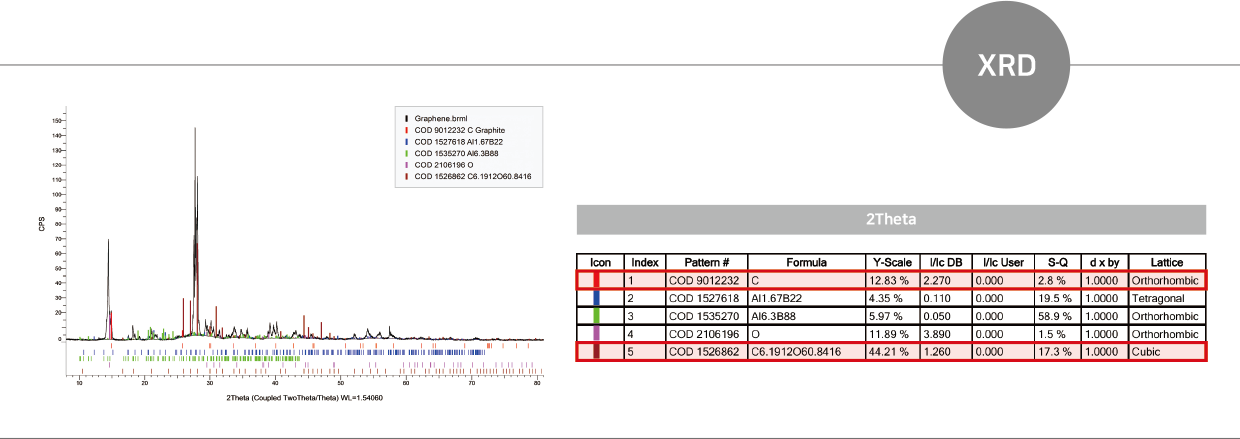
Graphene XRD data
Unlike graphene made by conventional chemical exfoliation and CVD, G-TIM is an analysis data for the presence of
C through XRD analysis of transparent graphene colloid made by chemical decomposition of graphite.
The analysis images by SEM and TEM and the analysis data by XRD prove that high-quality graphene can be mass-produced
by breaking the van der Waals bond.
Graphene XRD data
Unlike graphene made by conventional chemical exfoliation and CVD, G-TIM is an analysis data for the presence of C through XRD analysis of transparent graphene colloid made by chemical decomposition of graphite. The analysis images by SEM and TEM and the analysis data by XRD prove that high-quality graphene can be mass-produced
by breaking the van der Waals bond.
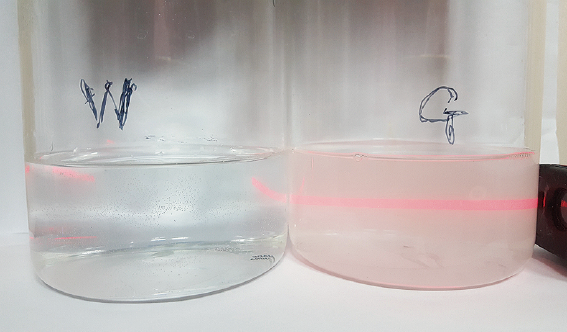
Current status of the graphene market
The image of transparent graphene colloid analyzed by TEM confirms at least 2 to 10 layers, but when calculating the light
transmittance of black graphene, it is estimated to be at least 50 to hundreds of layers.
When black graphene is mixed with polymer, the particles cause the radiation nozzle to malfunction, and the particle size
interferes with the chemical bonding with the polymer, limiting anti-static and color expression. The CVD method is difficult to mass-produce, so commercialization is limited.
Current status of the graphene market
The image of transparent graphene colloid analyzed by TEM confirms at least 2 to 10 layers, but when calculating the light transmittance of black graphene, it is estimated to be at least 50 to hundreds of layers.
When black graphene is mixed with polymer, the particles cause the radiation nozzle to malfunction, and the particle size interferes with the chemical bonding with the polymer, limiting anti-static and color expression. The CVD method is difficult to mass-produce, so commercialization is limited.
Graphene imaged by TEM▼
Graphene imaged by TEM▼
Tyndall phenomenon▼
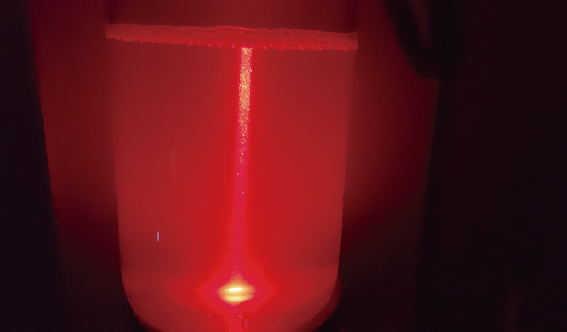
Tyndall phenomenon▼
Graphene imaged by SEM
SEM image after the first decomposition process
of graphite Van der Waals bonds – 3D image showing
at least 50 graphene layers
SEM image after the first decomposition process
of graphite Van der Waals bonds – 3D image showing
at least 50 graphene layers

Graphene imaged by SEM
SEM image after the first decomposition process of graphite Van der Waals bonds – 3D image showing at least 50 graphene layers
SEM image showing the two-dimensional boundary after removing Van der Waals bonds from graphite laminated with graphene
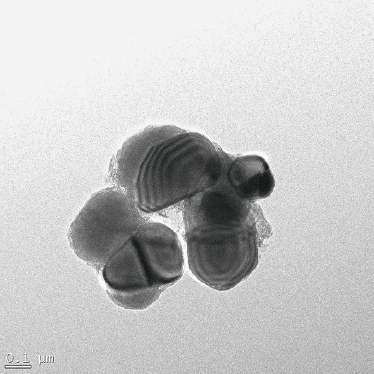
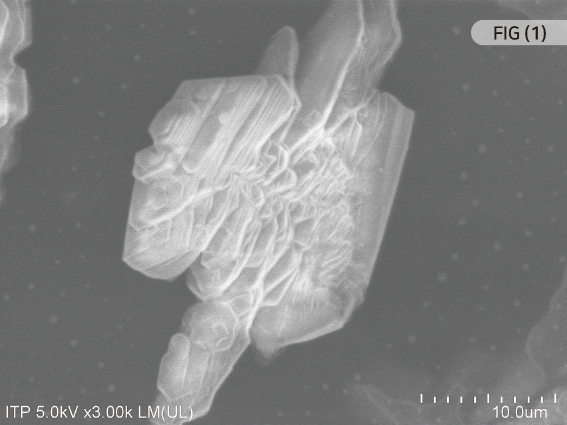
Image of graphene particles recrystallized from
high-concentration graphene colloid
A closer look at the left graphene crystal, which is made up of multiple layers of plates,
reveals the reassembly of small graphene fragments in FIG (4).
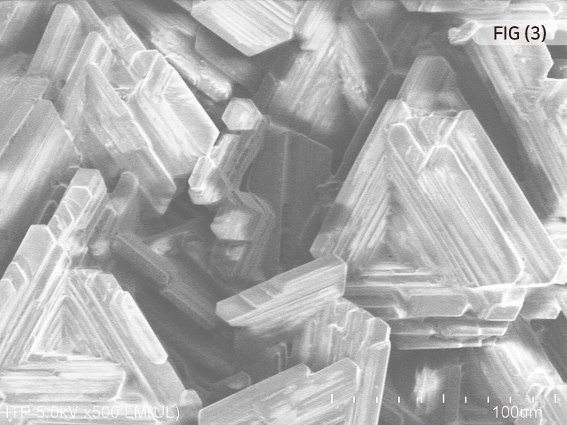
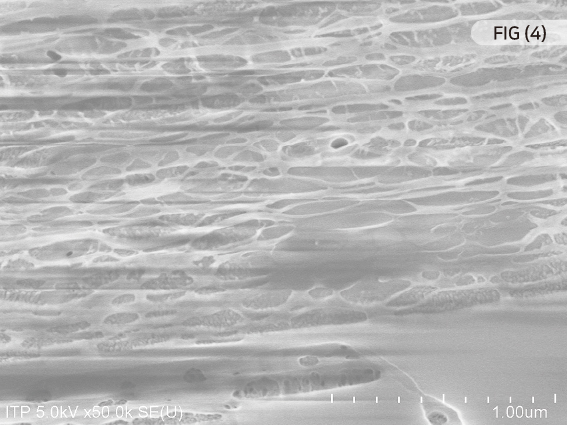
Image of graphene particles recrystallized from
high-concentration graphene colloid
A closer look at the left graphene crystal, which is made up of multiple layers of plates,
reveals the reassembly of small graphene fragments in FIG (4).
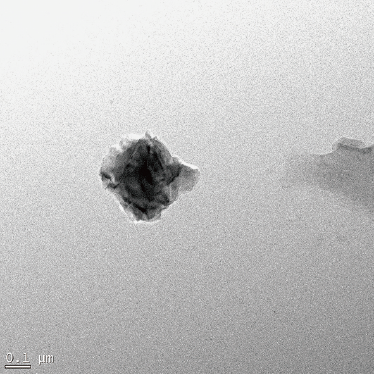
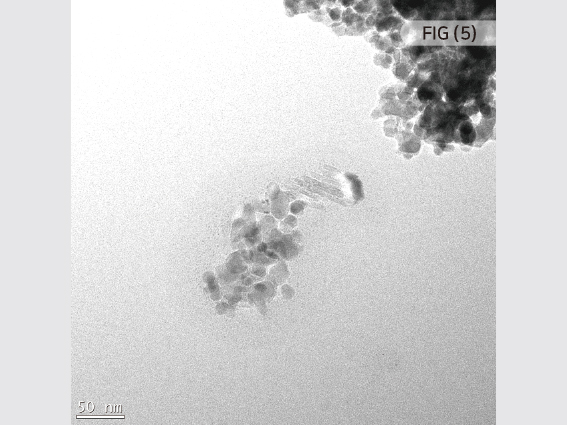
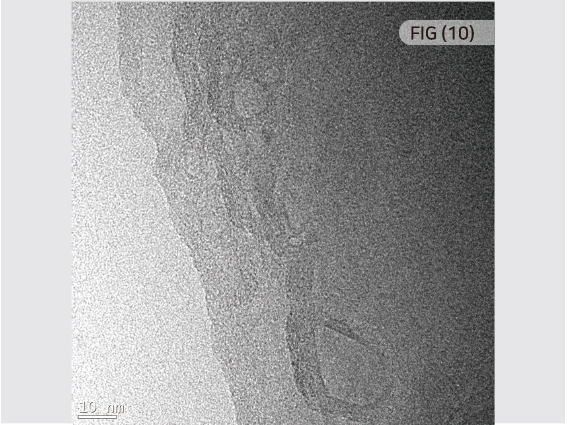
Graphene imaged by TEM
Small spots in the background are graphene oxide that has been decomposed to a single atomic level.
The dark color is multiple layers of graphene. The light-colored part of the image is a graphene image that
is close to one layer, with small spots projected.
Graphene imaged by TEM
Small spots in the background are graphene oxide that has been decomposed to a single atomic level. The dark color is multiple layers of graphene. The light-colored part of the image is a graphene image that is close to one layer, with small spots projected.
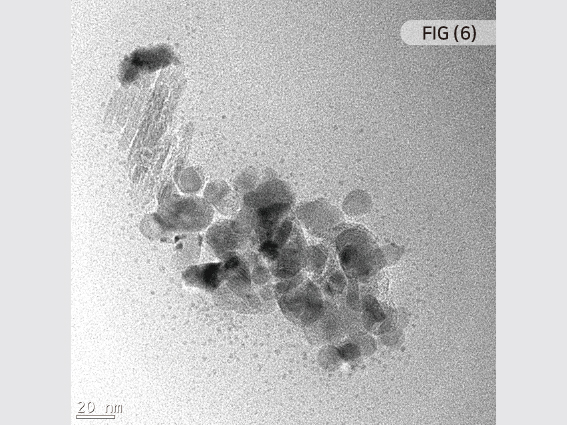
Figure 7 shows the boundaries of graphene at the top and bottom when graphene is overlapped.
Figure 8 Enlarging Figure 7 confirms the lattice structure of graphene.
The eco-friendly chemical decomposition method of GTIM can mass-produce single-atom layer graphene with a quantum dot lattice structure, and the neutralization of strong acids and removal of organic solvents used in the conventional graphite decomposition process are not necessary.
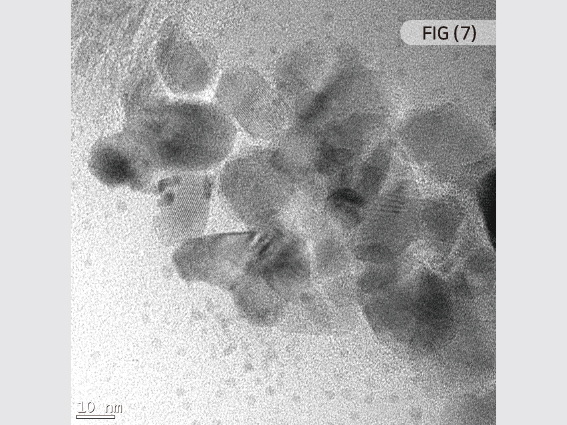
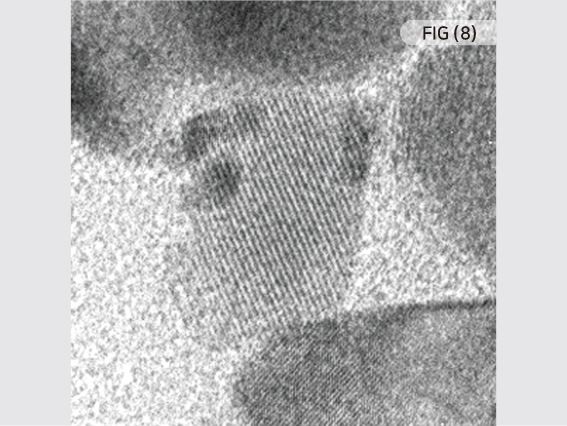
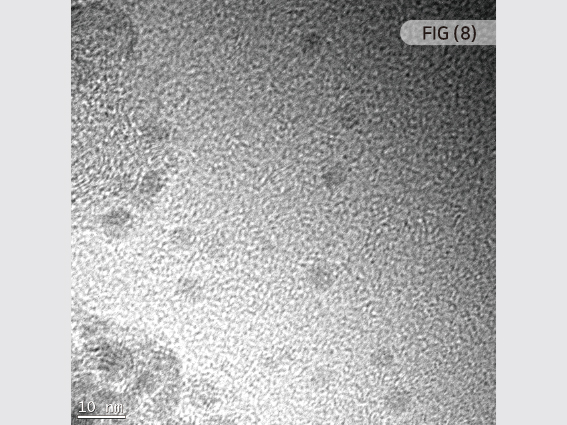
Differences in light and dark in areas where graphene of
a two-dimensional planar structure overlaps.
Differences in light and dark in areas where graphene of
a two-dimensional planar structure overlaps.